
Financial Analysis and Lessons from the TechServe Alliance Operating Practices Report
How Do High-Profit Technology Staffing Firms Manage Their P&L? Part 1
Successful staffing firms are the ones that effectively manage their revenue, control their expenses, and support their producing staff to help them reach their full potential (or, in some cases, make the difficult decision to manage them out of the business). To do this well, leaders in a business must first understand how money flows in and out of the company. This allows them to manage the business, and its people, by those numbers.
This is the first in a two-part series drawing upon a recent presentation by Rick Carlson, director of the TechServe Sales Recruitment Management Program, and founder and president of Harvyst Consulting Partners. In the presentation, Carlson outlined basic financial analysis for staffing firms – the numbers staffing firm leaders should know and how to calculate them. Although the terms can be daunting for leaders without accounting experience, the calculations – laid out below – are relatively simple and essential to understanding the financial health of your business. With data from the 2022 TechServe Alliance Operating Practices Report (OPR), Carlson also highlighted industry trends in these financial metrics.
Financial analysis for technology staffing firms
According to Carlson, there are three numbers that are the most important for every staffing firm leader to know:
- What percent of your company’s gross revenue is gross profit (or margin)?
- What percent of your company’s revenue is spent on expenses?
- What is your EBITDA (earnings before interest, taxes, depreciation, and amortization)?
Carlson notes that firms that conduct both contract and permanent placement should calculate gross profit for these two areas of the business separately. Due to the differing revenue and cost structures, permanent placement can artificially inflate the overall gross profit of a firm that does both.
One final calculation, used in the determination of a ‘high-profit’ firm for the purposes of the OPR, is the return on assets. Simply put, this is the percentage returned to the business of the value of that firm’s total assets. According to Carlson, this is a good indicator of the firm’s ability to survive and prosper.
Financials and the 2022 Operating Practices Report (OPR)
Let’s look at how firms in our industry are performing and some of the trends that emerge from the 2022 Operating Practices Report (OPR) data. For comparison, the OPR financial data was used to create profiles for a ‘typical’ firm (the median of all companies responding), and a ‘high-profit’ firm. Carlson highlights two critical measurements: gross profit and SG&A expenses. Comparing the high-profit and typical firms shows how small variances in individual metrics can add up to significant differences overall.
Financials of a Typical Firm vs a High-Profit Staffing Firm
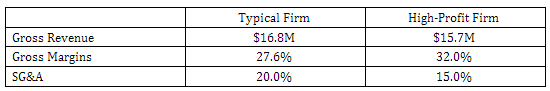
As we can see in the above table, “For a million dollars less revenue, they drove almost three-quarters of a million more in profit,” Carlson says of the high-profit firms. The difference is the higher gross margin of the high-profit firm.
The differences between the typical firm and the high-profit firm become more visible when you calculate how much of the gross margin drops to profit, a critical measurement according to Carlson. To determine the percentage, divide profit by gross margin.
For the typical firm, with a profit of $1.1 million and a gross margin of $4.6 million, the percentage that drops to profit is 22.8%. Contrast that with the high-profit firm, where a profit of $1.8 million and a gross margin of $5 million results in 36.6% of margin dropping to profit.
The target for this percentage, Carlson points out, is 33% or greater. Reaching that target would have a significant impact on the bottom line. “If we went to 33% at the typical firm,” he notes, “we’d add almost half a million dollars in profit.”
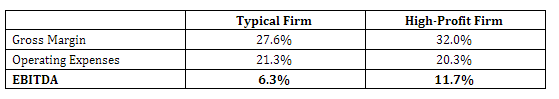
Managing SG&A expenses is critical
The reason this is such an important calculation is that it highlights potential issues in the finances of a company that might otherwise be obscured. Carlson says that you can’t underestimate the importance of SG&A management on your firm’s financial health. To illustrate, he contrasts the typical and high-profit firms once again, this time with respect to their EBITDA. With a 27.6% gross margin and 21.3% operating expenses, the typical firm’s EBITDA is 6.3%. For the high-profit firm, with a 32% gross margin and 20.3% operating expenses, the EBITDA jumps to nearly double that of the typical firm, to 11.7%.
Managing SG&A is complicated for staffing firms
The lion’s share of SG&A expenses is payroll: 69.5% for a typical firm and 67.5% for those in the high-profit group. For a staffing firm, however, cutting payroll will ultimately reduce revenue. For this reason, Carlson recommends focusing on managing the ‘S’ of SG&A more effectively. “If it represents 70% of your expenses,” he says, “it’s a natural place to go to figure out how to squeeze more out of it.” This is the focus of the second part in this series, coming soon – maximizing the value from your payroll expense.
Although the return on cuts to the ‘G&A’ of SG&A is likely to be less significant, Carlson points out two areas in which gains can be made. First, he recommends looking for monthly aberrations. For example, there might be an extraordinarily high phone bill or more money spent on office supplies in a quarter. These outlying expenses can be addressed on an individual basis.
Secondly, Carlson recommends, testing those expenses for the value you receive. Job boards are a good example. Data from the 2021 OPR suggests that most firms rely heavily on job boards for sourcing; 30% of small firms say they do so, as do 43% of the large firms. Interestingly, of the high-profit group, 25.4% report using job boards. Those high-profit firms report that they rely heavily on referrals and on LinkedIn, which may offer a greater return on investment. This is an example of a ‘G&A’ expense where firms should examine the value they receive from the service in relation to what they’re paying.
Want more? The presentation covered many more insights and information than is possible to outline here. TechServe Alliance members can check out the full recording of the presentation here. Stay tuned for the second part of this two-part series, in which Carlson shares how to use this financial data to measure and maximize your employee profitability.